Ap Physics Lab
Safin Singh
Liao
AP Physics C
18 August 2022
Problem Statement
Purpose: Determine the relationship between the mass and radius of disks with a common thickness and density but different radii. Calculate the uncertainty associated with the relationship.
Materials and Equipment
Step 4: Since the Area of the disk is a circle, substitute equation 3 into equation 2 and solve for m.
(m = \rho \cdot \pi r^{2}h)
Procedure
-
The mass of the disk can be measured using the balance. In order to do so, the balance must first be zeroed and then the disk should be placed on the balance.
The radius of the disk can be measured using the meter stick. One end of the meter stick will be placed at the center of the disk and it will be extended towards the outside edge of the circle.
-
The precision of the meter stick we used was 1mm (0.1cm) because that was the smallest marking on the meter stick that we used. Our measurements are recorded to the hundredth of a centimeter (nearest 0.1mm) because we used the 2/5/8 rule to add one more digit of precision to each radius measurement.
-
Data table:
| Radius (cm) | Mass (g) | Radius2 (cm2 ) | |
|---|---|---|---|
| 6.92 | 0.71 | 47.89 | |
| 5.32 | 0.37 | 28.30 | |
| 4.12 | 0.25 | 16.97 | |
| 3.08 | 0.13 | 9.49 | |
| 2.28 | 0.08 | 5.20 |
-
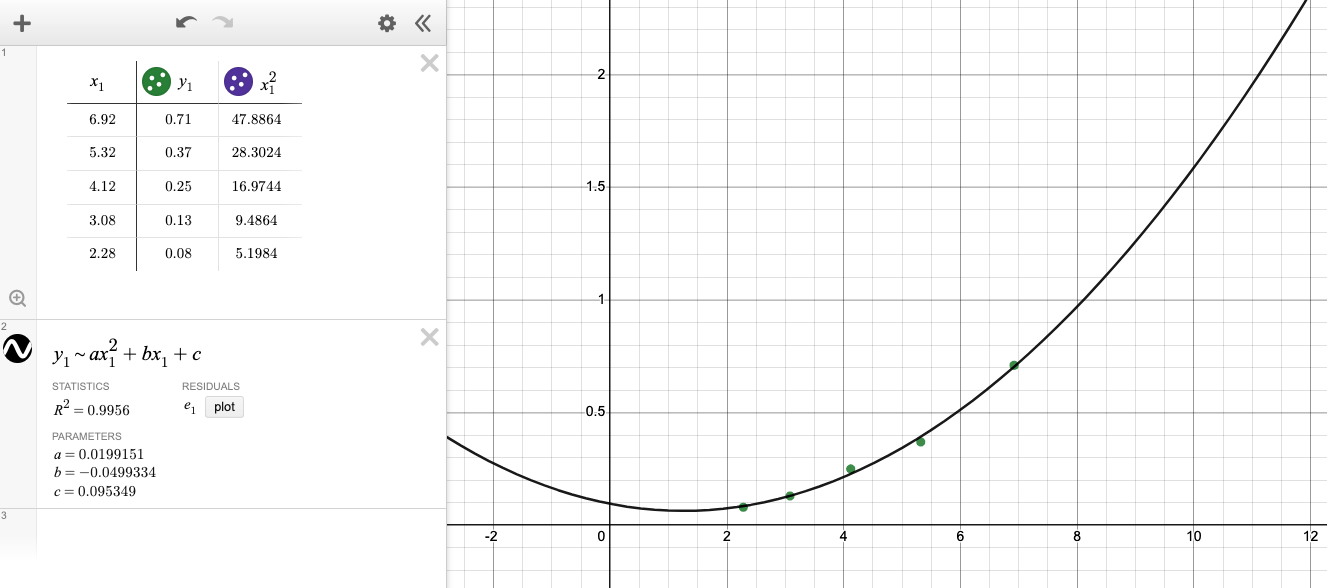
Nonlinear regression
Is this graph linear or nonlinear? Nonlinear
Equation: y = 0.0199151x2 - 0.0499334x + 0.095349
-
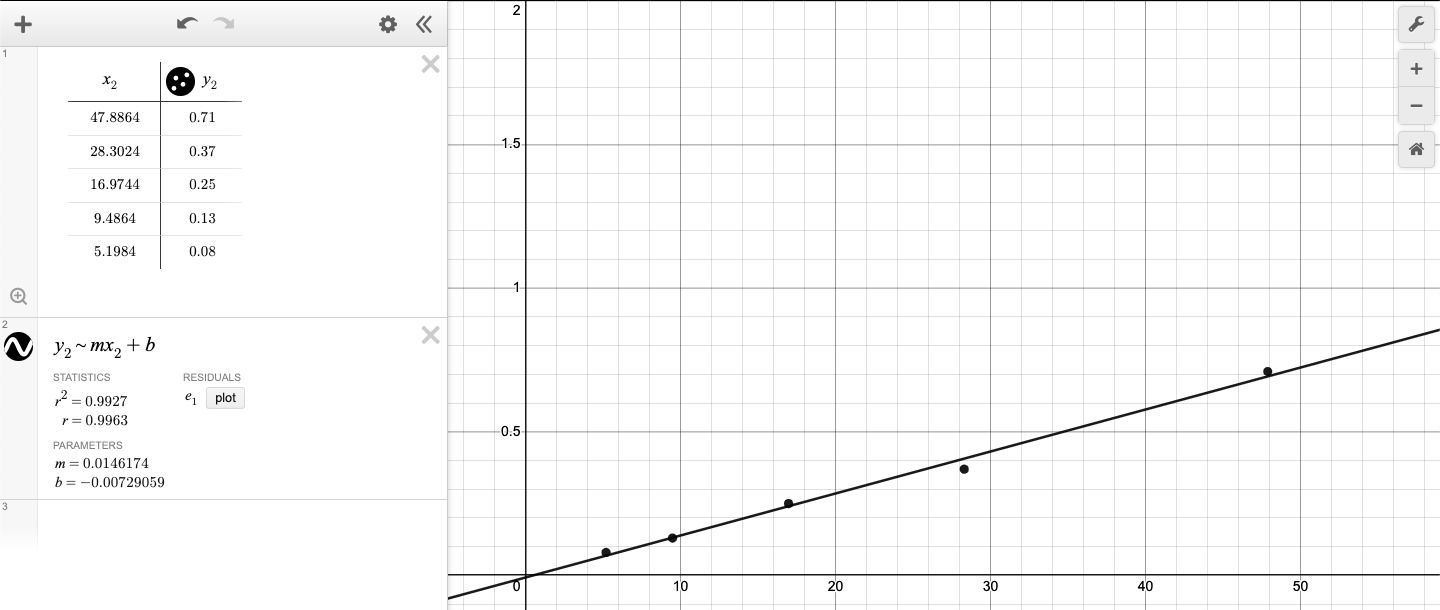
Linear regression
-
Equation: y = 0.0146174x - 0.00729059
Analysis Questions
-
The independent variable best represents the radius squared because the mass is linearly correlated to the radius squared.
-
The slope represents the increase in mass for every increase in radius2 by 1cm2.
-
Yes, the line of best fit(s) should be adjusted to pass through (0, 0) because a disk with radius 0 centimeters should have a mass of 0 grams.
-
Measured value of disk thickness: 0.00125 cm
Slope of best fit line: 0.0146174 g/cm2
(\rho \cdot \pi h = 0.0146174)
(\rho \cdot 3.14 \cdot 0.00125 = 0.0146174)
(\rho = 3.72417834 \approx 3.72g/cm^{3})
Actual density of aluminum: 2.7 g/cm3
% Error: (\frac{3.72\ g/cm^{3} - 2.7g/cm^{3}}{2.7g/cm^{3}} \times 100\% = 37.78\%\ \approx \ 38\%)
-
Some of the factors that could have caused error are:
-
The disks may not have been cut in perfect circles, causing inconsistencies in disk weight
-
The thinness of each disk made it very difficult to measure with the provided ruler, causing the calculation for density to be very off
-
Our percent error is positive because the measurement for disk thickness is likely inaccurate since we did not have a precise way to measure it. This caused a higher-than-expected density, leading to a positive percentage error.
Synthesis Questions
-
If we had chosen disks with greater thickness, the slope of the line would increase. This is because if the radius of a disk is kept constant while its thickness increases, its mass will increase because there is simply more of the material in the disk. As a result, the slope of the line would increase. However, the experimental density would remain the same, as the increase in thickness would be accounted for in the increased slope, so the (p \cdot \pi h = slope) equation used to determine density ((\rho)) would yield the same value for density. Something to note is that a more thick disk may have been easier to find a more accurate height for, leading to a more precise calculation for density.
-
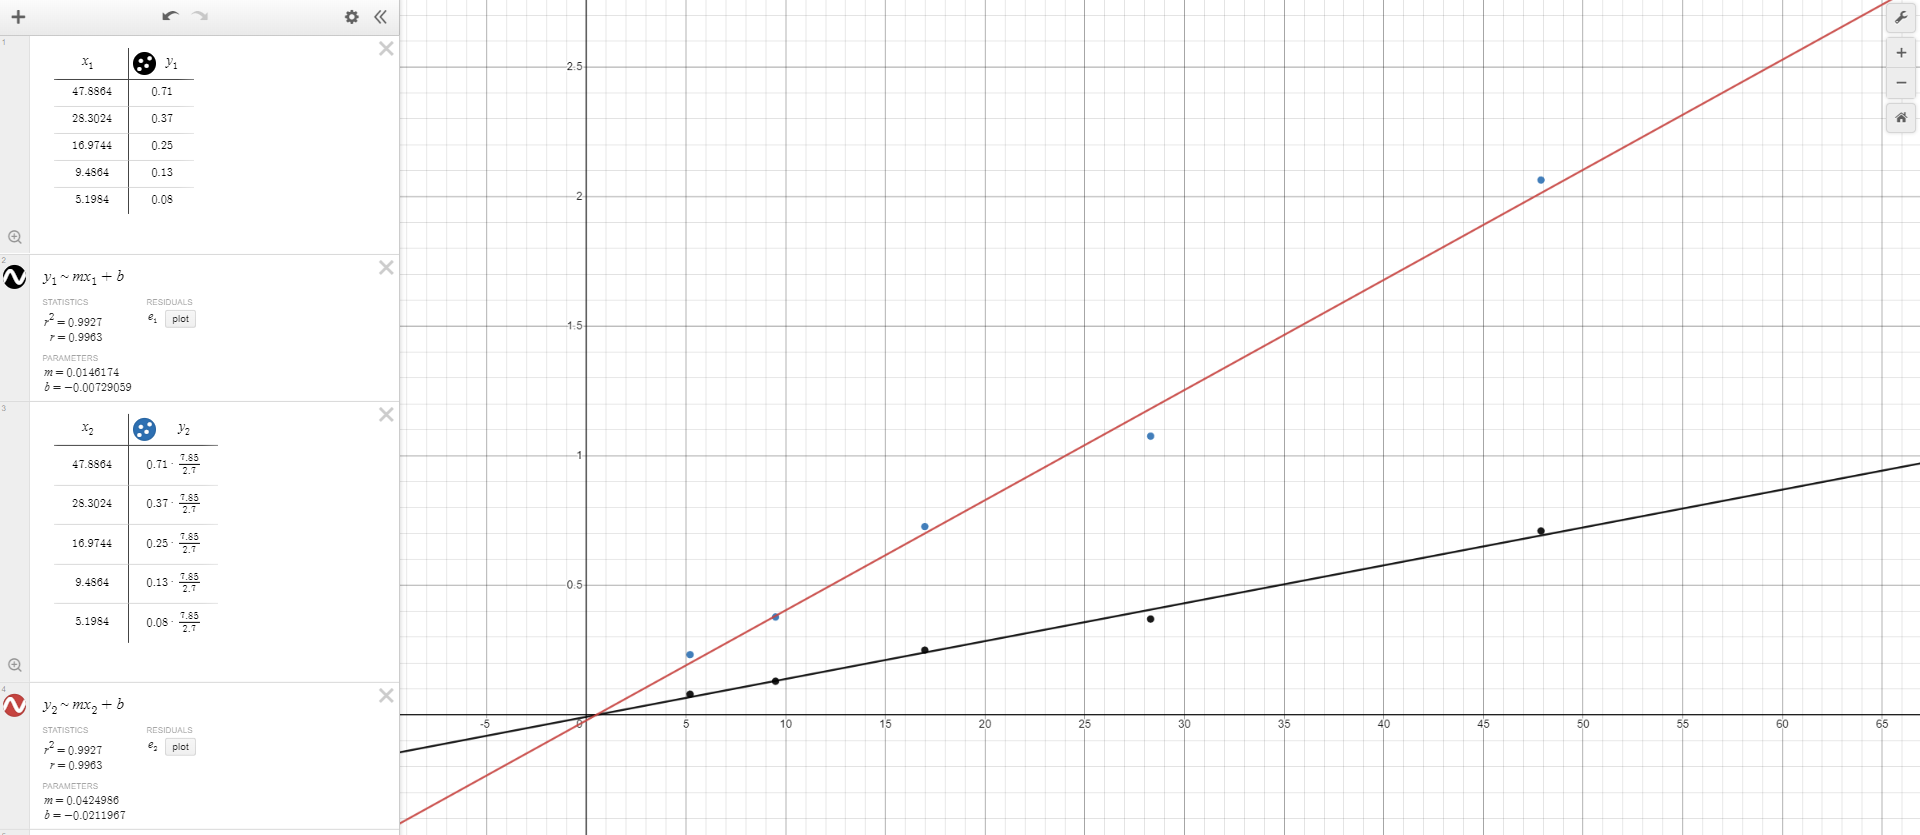
The density of steel is larger than that of aluminum, coming out to 7.85 g/cm3 compared to aluminum’s 2.7 g/cm3.
The following graph represents what a line of best fit would look like for Mass (g) vs Radius2 (cm2) for both steel and aluminum (see next page).
Based on the equation (m = \rho \cdot \pi r^{2}h), it is known that density and mass are linearly proportional. Therefore, in order to draw a line of best fit for steel disks, I simply multiplied each measured mass value for the aluminum disks by the constant (\frac{7.85}{2.7}), which represents the ratio between the density of steel to the density of aluminum. From there, I plotted a linear regression line for this new adjusted data, yielding the above graph.
-
(slope = \rho \cdot \pi h)
(\rho = \frac{\text{slope}}{\pi h})
(slope = 122\frac{\text{kg}}{m^{2}} \cdot (\frac{1m}{100cm})^{2} \cdot (\frac{1000g}{1kg}) = 12.2\frac{g}{cm^{2}})
(h = 0.5cm)
(\rho = \frac{12.2g/cm^{2}}{3.14 \cdot 0.5cm} \approx 7.77\frac{g}{cm^{3}})
The calculated density is closest to that of iron, which has a density of 7.8 g/cm3. Therefore, the group’s disks are likely made of iron.
Multiple Choice
-
(m = \rho \cdot \pi r^{2}h)
(c = 2\pi r)
(r = \frac{c}{2\pi})
(m = \rho \cdot \pi({\frac{c}{2\pi})}^{2}h)
(m = \rho \cdot \frac{c^{2}}{4\pi}h = c^{2} \cdot \frac{1}{4\pi}h \cdot \rho)
(slope = \frac{m}{c^{2}} = \frac{h\rho}{4\pi})
Therefore, the correct answer is E.
-
N/A
-
(\rho = \frac{m}{V})
(m = \rho V)
(V = \frac{4\pi}{3}r^{3})
(m = \rho \cdot \frac{4\pi}{3}r^{3}) where both (\rho) and (\frac{4\pi}{3}) are constants. Therefore, in order to create a linear graph relating the mass of a sphere to its radius r, the student would need to plot mass m vs r3. Therefore, the correct answer is C.